Utilise real-time, whole system data
Whole system visibility of planned care ‘waitsʼ and ‘appointment availability’ in real time
Maximise resource utilisation
Supports greater utilisation of ICS wide resource
View pressures and resources
Displays both live demand and capacity data to inform decision making
Reduce wait times
Reduces lengthy wait times for patients through efficient patient flow
Drill into data
Identifies growing pressure by speciality and sub speciality
Supports improved patient outcomes
The maximisation of resources and improvement of patient flow allows for earlier treatment for patients
Real-time, centralised ‘helicopter’ View of whole-system demand and capacity data in planned care
SHREWD Elective transforms complex data from multiple systems and providers to provide a strategic overview of demand and capacity across all elective care pathways at trust level, across an entire ICS or more widely at regional or national level.
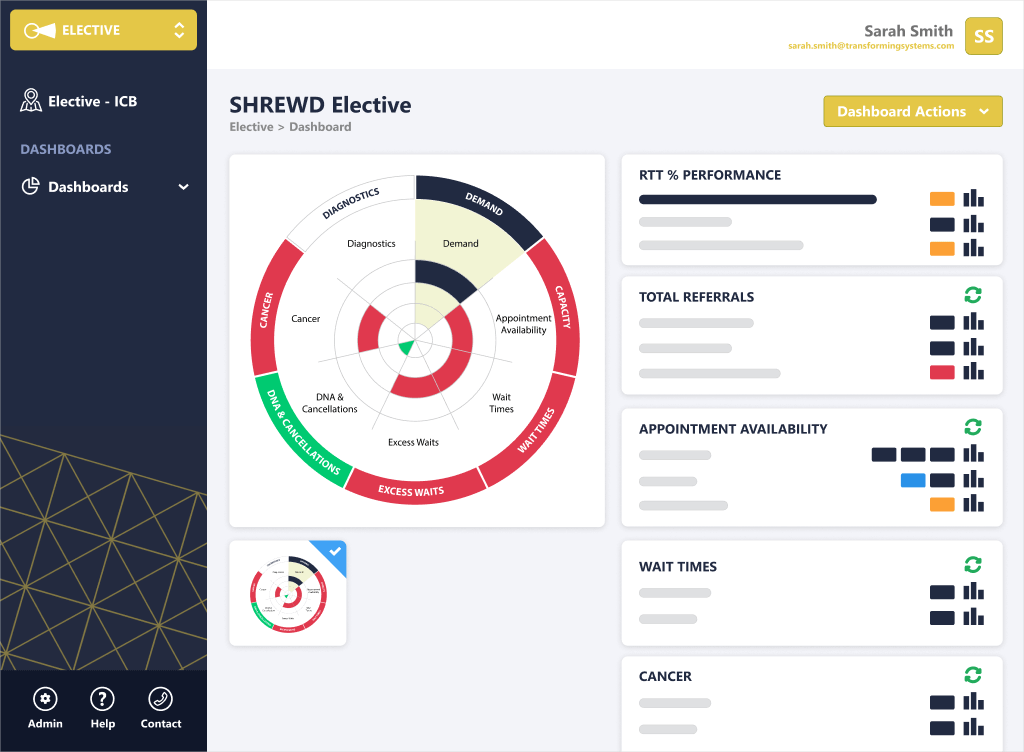
View whole-system demand and capacity
SHREWD Elective takes complex digitised data from all NHS elective care providers across a geographical footprint, including independent sector partners, and creates instant, whole-system visibility of demand and capacity in planned care. SHREWD Elective provides front line teams and operational leaders a real time view of pressure across multiple providers or services.
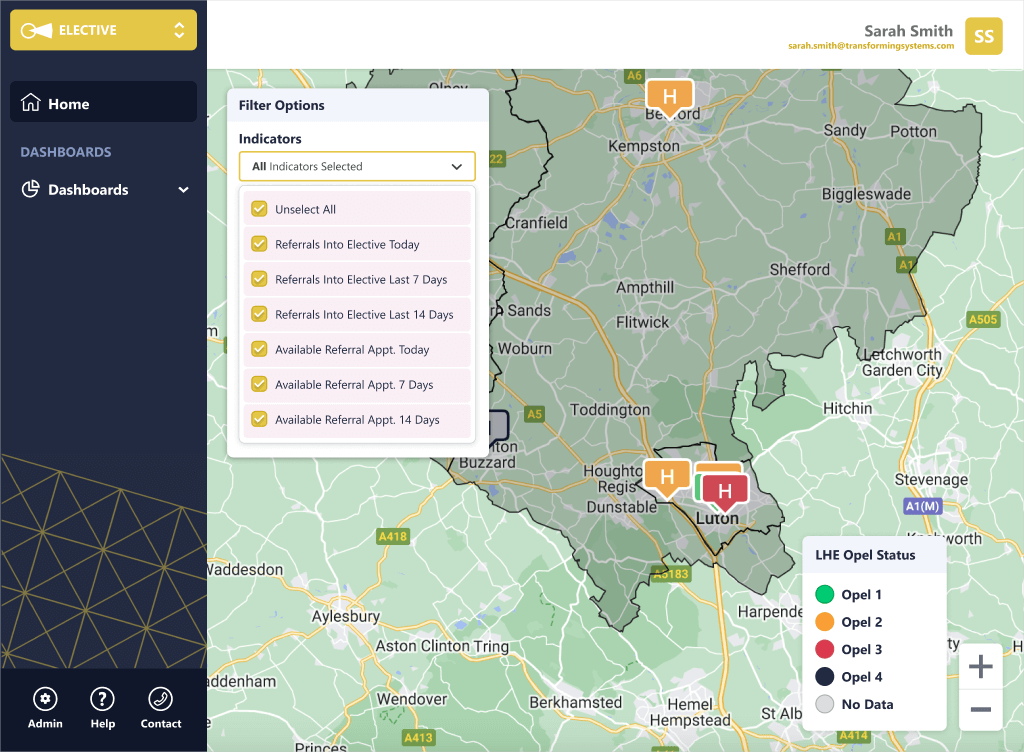
Utilise a single version of the truth
SHREWD Elective provides a single version of the truth, that identifies growing pressure in planned care by speciality and sub speciality level, supporting system wide response efforts, in line with the vision of centralised elective care hubs, that enable integrated and tactical response efforts to resolve excess waits and delays; improving flow and offering safer, more effective care for patients.

View data at multiple levels
The dashboard compiles complex data, taking account of different local operating practices and data systems, producing a clear visual guide of pressure. SHREWD Elective highlights pressure in specialty pathways and opportunities for improvement to meet both short and long-term demand. This real-time data is displayed in a simple heatmap, making it easy to quickly identify areas of pressure and capacity available, and allow users to drill down to view precise causes of pressure, within a few clicks.
What makes Elective different?
Captures and compiles data from multiple formats, sources, and providers
In-built notification system alerts users to live changes to prompt immediate action
Pressure is displayed via a dashboard dial and a heatmap
Filters allow users to view pressure based on key indicators or criteria
Data captured in real-time and is available to view across mobile and tablet


